GUI Journey: Probe Live Telemetry Watch
This page documents the probe-gui-watch journey, which exercises the live telemetry pipeline on the Probe screen — subscription handshake, per-device row streaming, and expand-to-detail interaction.
Overview
Journey ID: probe-gui-watchStatus: Implemented (placeholder artefacts — real recording pending on user Mac) Last Updated: 2026-04-19
What you'll see
- App boots on Planner; cursor moves to the sidebar and selects Probe.
- Probe screen opens empty for a brief moment while the telemetry subscription opens.
- First device row animates in (GPU 0, VRAM 41.2 / 48.0 GB, utilisation 63%), with a rolling sparkline.
- Three more devices join the list; utilisation and temperature values tick live for about five seconds.
- User hovers GPU 0, then clicks the row — the per-process breakdown panel slides down with CUDA context entries, power budget bar, and a pinned status header that keeps updating.
Journey not yet recorded.
Run the journey recorder to capture interactions:
./apps/macos/HwLedgerUITests/scripts/run-journeys.shWhat to watch for
- First-row latency — the gap between "subscription opens" and "first row visible" should be under 500 ms on a warm cache.
- Sparkline smoothness — the rolling utilisation chart should never jump or reset; it is backed by the same ring buffer the CLI
probe watchuses. - Expanded panel stability — once a device row is expanded, the header values continue to tick but the expanded detail does not unmount or re-layout.
Reproduce
bash
# 1. Bundle the app (Debug is enough for UI tests)
cd apps/macos/HwLedgerUITests
./scripts/bundle-app.sh --no-codesign debug

# 2. Grant Accessibility + Screen Recording in System Settings for Terminal/Xcode.

# 3. Run the journey (records recording.mp4 + keyframes + manifest.json)
swift test --filter ProbeJourneyTests/testProbeGUIWatch

# 4. Sync artefacts into the docs-site public tree
cd ../../..
bash docs-site/scripts/sync-journey-artefacts.sh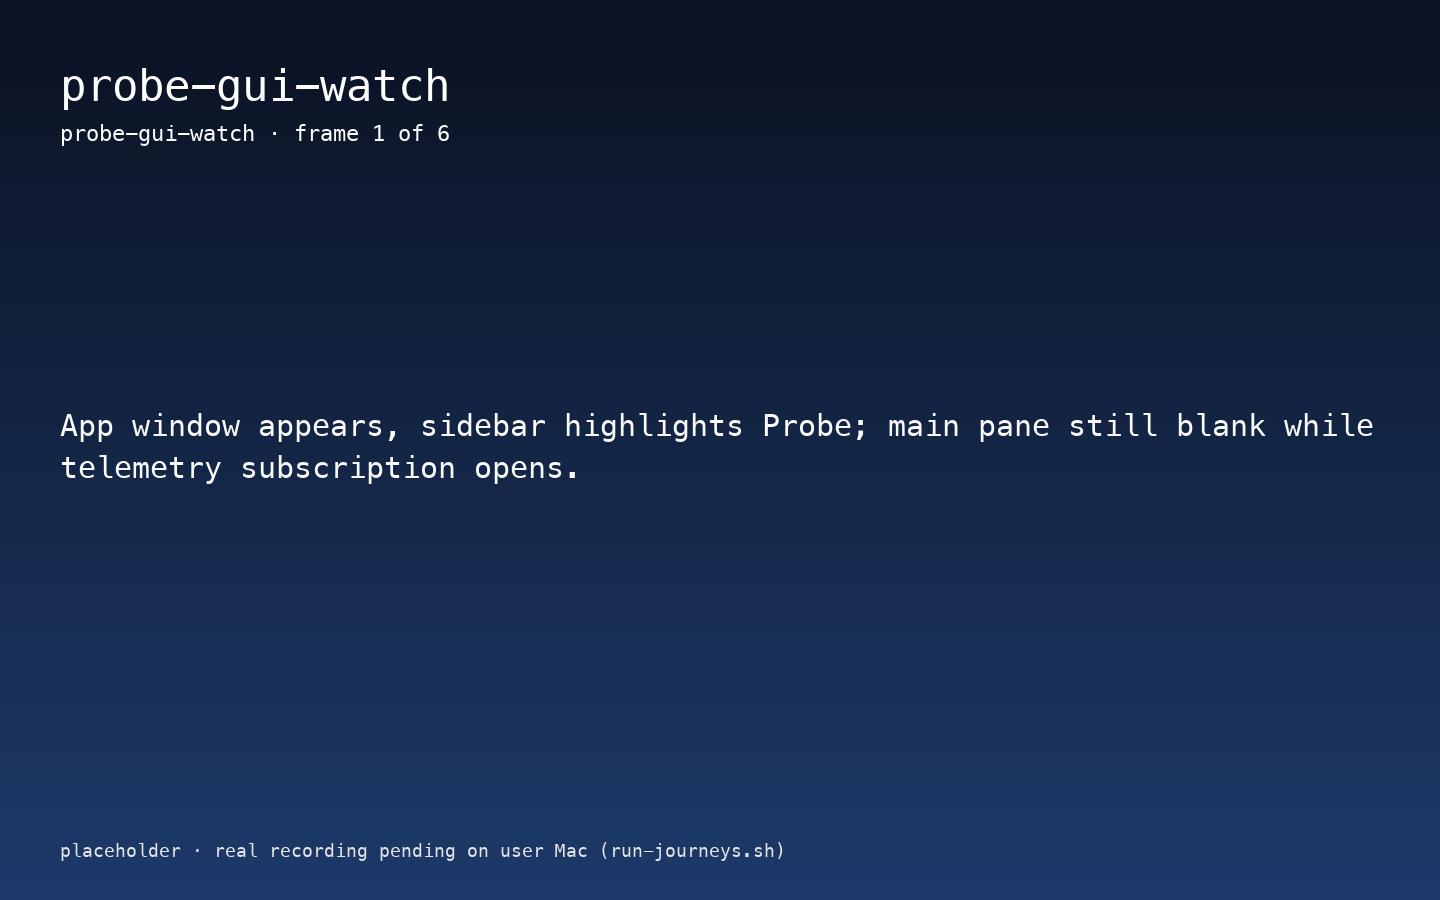